

Find your road through the market.
A live crypto chart with 169 indicators and a no-code strategy builder that backtests on real BTC/USDT history, with fees, slippage and funding on.
- 169indicators
- 94drawing tools
- 47strategy blocks
- 19timeframes
- spot and perpetuals
The chart owns the screen.

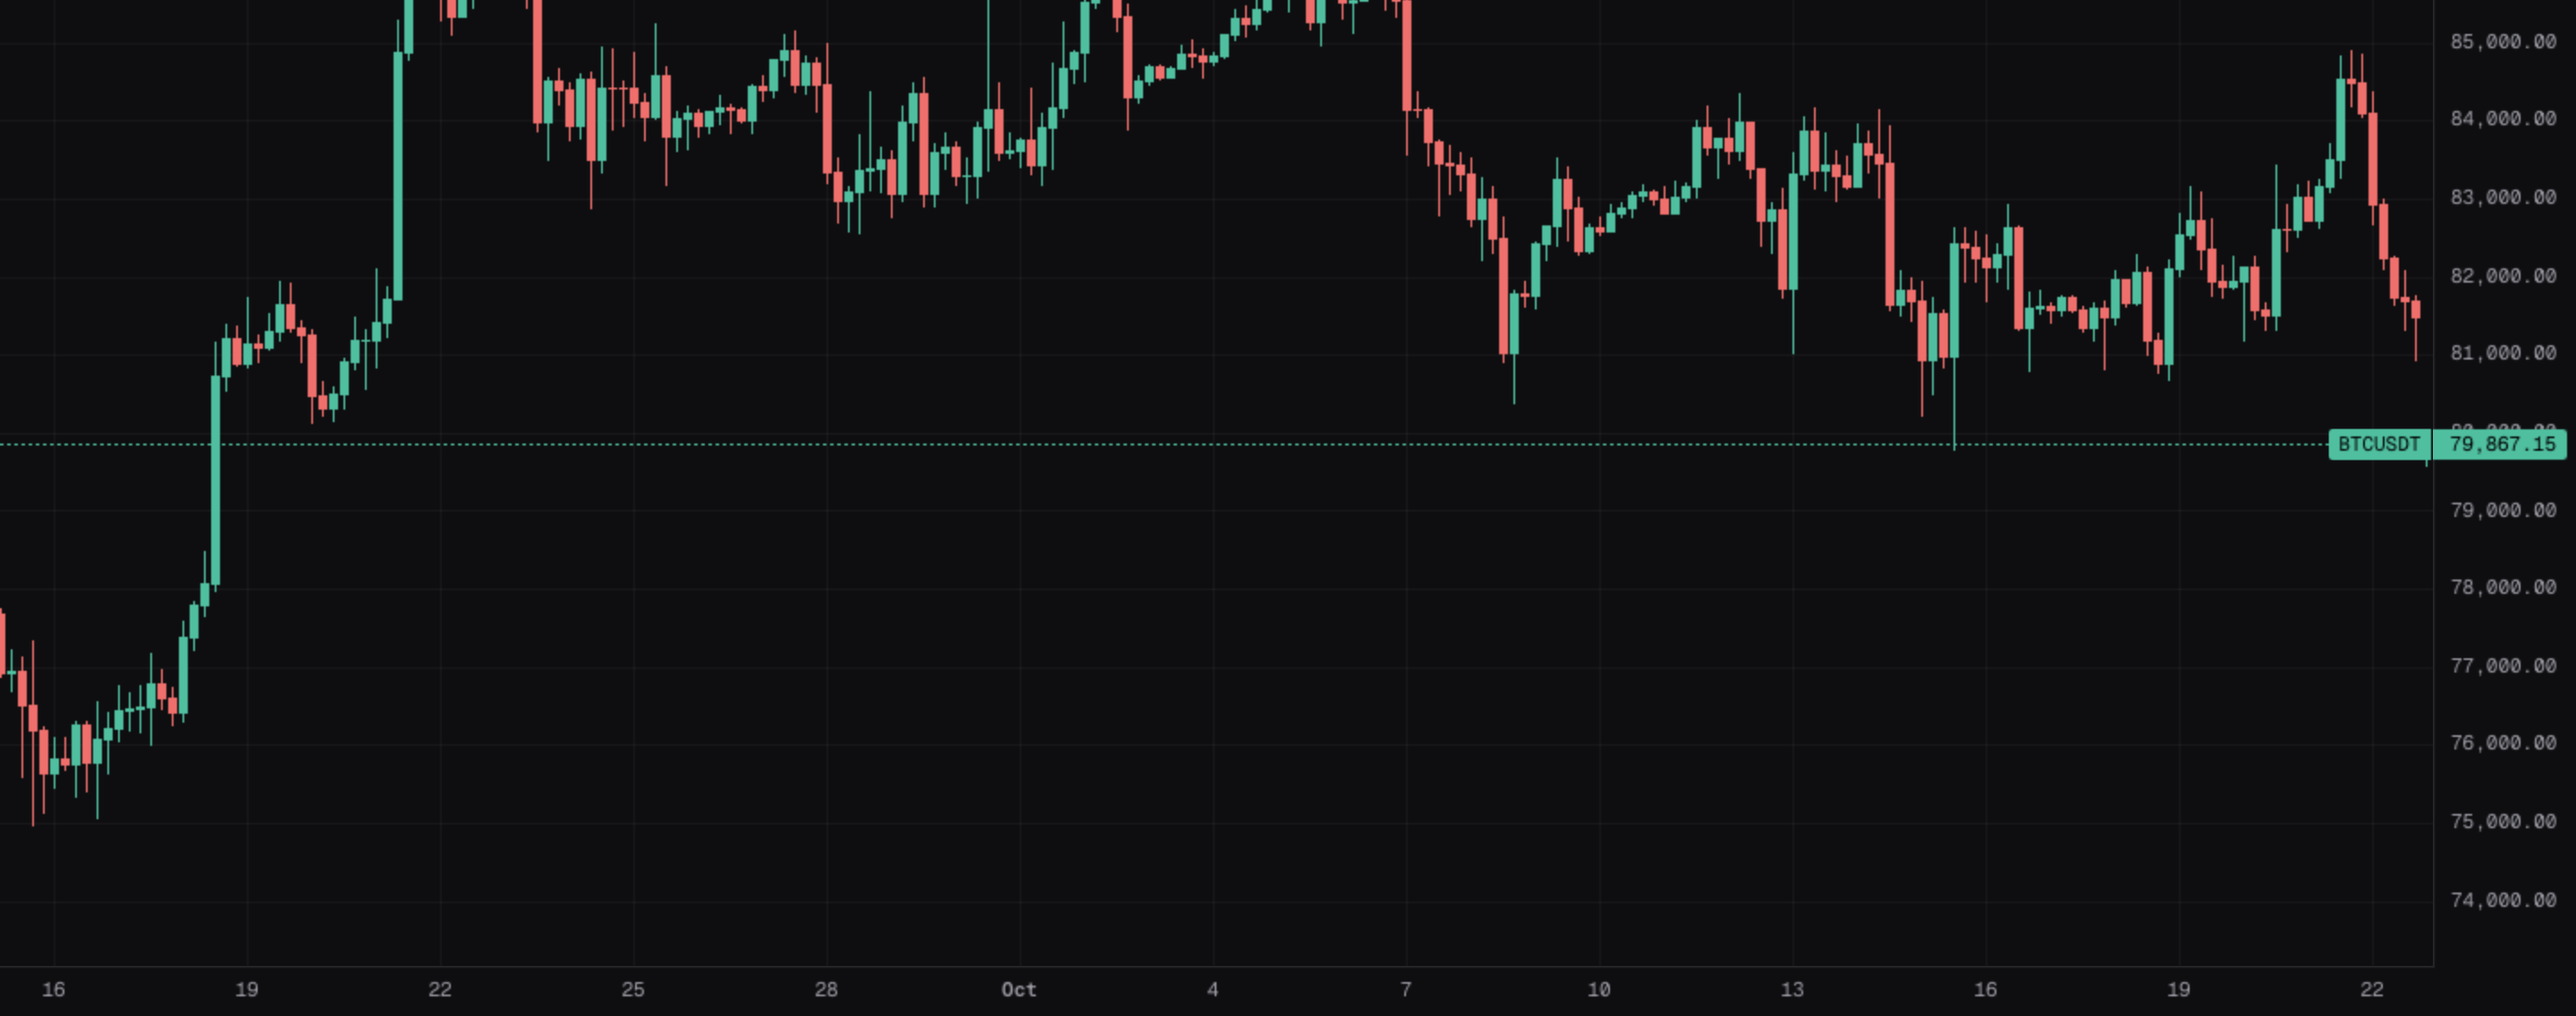
Live Binance prices for BTC, ETH, SOL, BNB and XRP, spot and perpetuals, on 19 timeframes from one minute to twelve months. Open it without an account.
169 indicators. One chart.
Moving averages to market structure, volatility to open interest. Change a setting and watch the chart redraw; feed one indicator into another, or read it from a higher timeframe.
- Exponential Moving Average
- Relative Strength Index
- Bollinger Bands
- Volume Profile
- Fair Value Gap
- SuperTrend
- Moving Average Convergence Divergence
- Keltner Channels
- Anchored VWAP
- Break of Structure
- Hull Moving Average
- Stochastic RSI
- TTM Squeeze
- Cumulative Volume Delta
- Order Blocks
- Ichimoku Kinko Hyo
- WaveTrend Oscillator
- Average Directional Index
- Funding Rate
- Head & Shoulders
- Parabolic SAR
- Schaff Trend Cycle
- Chandelier Exit
- Open Interest
- Supply / Demand Zones
- +144 more
- +154 more
94 drawing tools.
Lines, channels, pitchforks, Fibonacci, patterns, cycles, measures, order flow, shapes and notes. Mark the chart the way you read it; your drawings follow you to every device you sign in on.
Build the rule. No code.
Wire blocks on a canvas: 47 of them for indicators, comparisons, logic, timing, filters, exits and orders. Numbers connect to numbers and conditions to conditions, so a wrong wire can't happen, and Piproad reads your strategy back in plain English.
Test it before you trust it.
Backtests run in your browser on our candle history, the same way every time, and the engine never sees a bar before it closes. Every run is saved with the settings it used, so you can compare them later.
- Checked
- once per closed bar
- Fills
- at the next bar's open
- Stops and targets
- on 1-minute candles
- Fees
- 0.05% a side on perps, 0.10% on spot
- Slippage
- 0.02% a fill
- Funding
- real history on perps
Know the moment it happens.
Alerts on price, indicators and whole strategies run on our alert server, so they fire with the tab closed.
- In the appa toast and the alert log
- Pushto every device you allow
- Webhooka JSON POST to your URL
- EmailComing soonto your account address
Make it yours.
Two themes, twelve candle colours, six accents and up to four charts side by side. Try the colours and layouts here; with an account, the app keeps your choices on every device.
Your account stays yours.
- Passkeys and two-factor sign-inSign in with a passkey, or add an authenticator app with backup codes.
- Every device in one listSee where you're signed in and sign any device out, or all of them at once.
- Signing out clears the deviceYour synced work leaves that browser when you sign out.
- Export or delete everythingDownload all of it as JSON, or delete your account and every bit of its data.
- No ads, no tracking cookiesWe don't sell your data, and we never ask for your exchange keys.
The road ahead.
Charts, indicators, strategies and backtests are live. Next, the same strategies run on live prices with simulated money, then trade on real exchanges.
- Charts and 169 indicatorsLive
- Strategy builder and backtestsLive
- Paper tradingComing soon
- Live trading on Delta ExchangeComing soon
- Binance tradingComing soon
- Portfolios and parameter sweepsComing soon
Free while we're in early access.
Every feature, no card. Paid plans come later, and you'll hear from us before anything changes.
Questions, answered.
Is Piproad free?
Yes. During early access every feature is free and needs no card. Paid plans come later, and we'll tell you before anything changes.
Do I need an account?
Not to look: the live chart opens without one. An account keeps your indicators, drawings, strategies and alerts, and syncs them to every device you sign in on.
Does Piproad trade for me?
Not today. Piproad charts, backtests and alerts; it never places orders. Paper trading with simulated money and live trading on Delta Exchange are next on the roadmap.
Where does the data come from?
Binance: spot and USDⓈ-M perpetual candles, funding and open interest, kept in our database for history, with live prices streamed from Binance straight to your browser.
Which markets can I chart?
BTC/USDT spot, and the BTC, ETH, SOL, BNB and XRP perpetuals, on 19 timeframes from one minute to twelve months.
Is this investment advice?
No. Piproad is a research tool. A backtest shows how a rule would have behaved on past prices, not what it will do next.